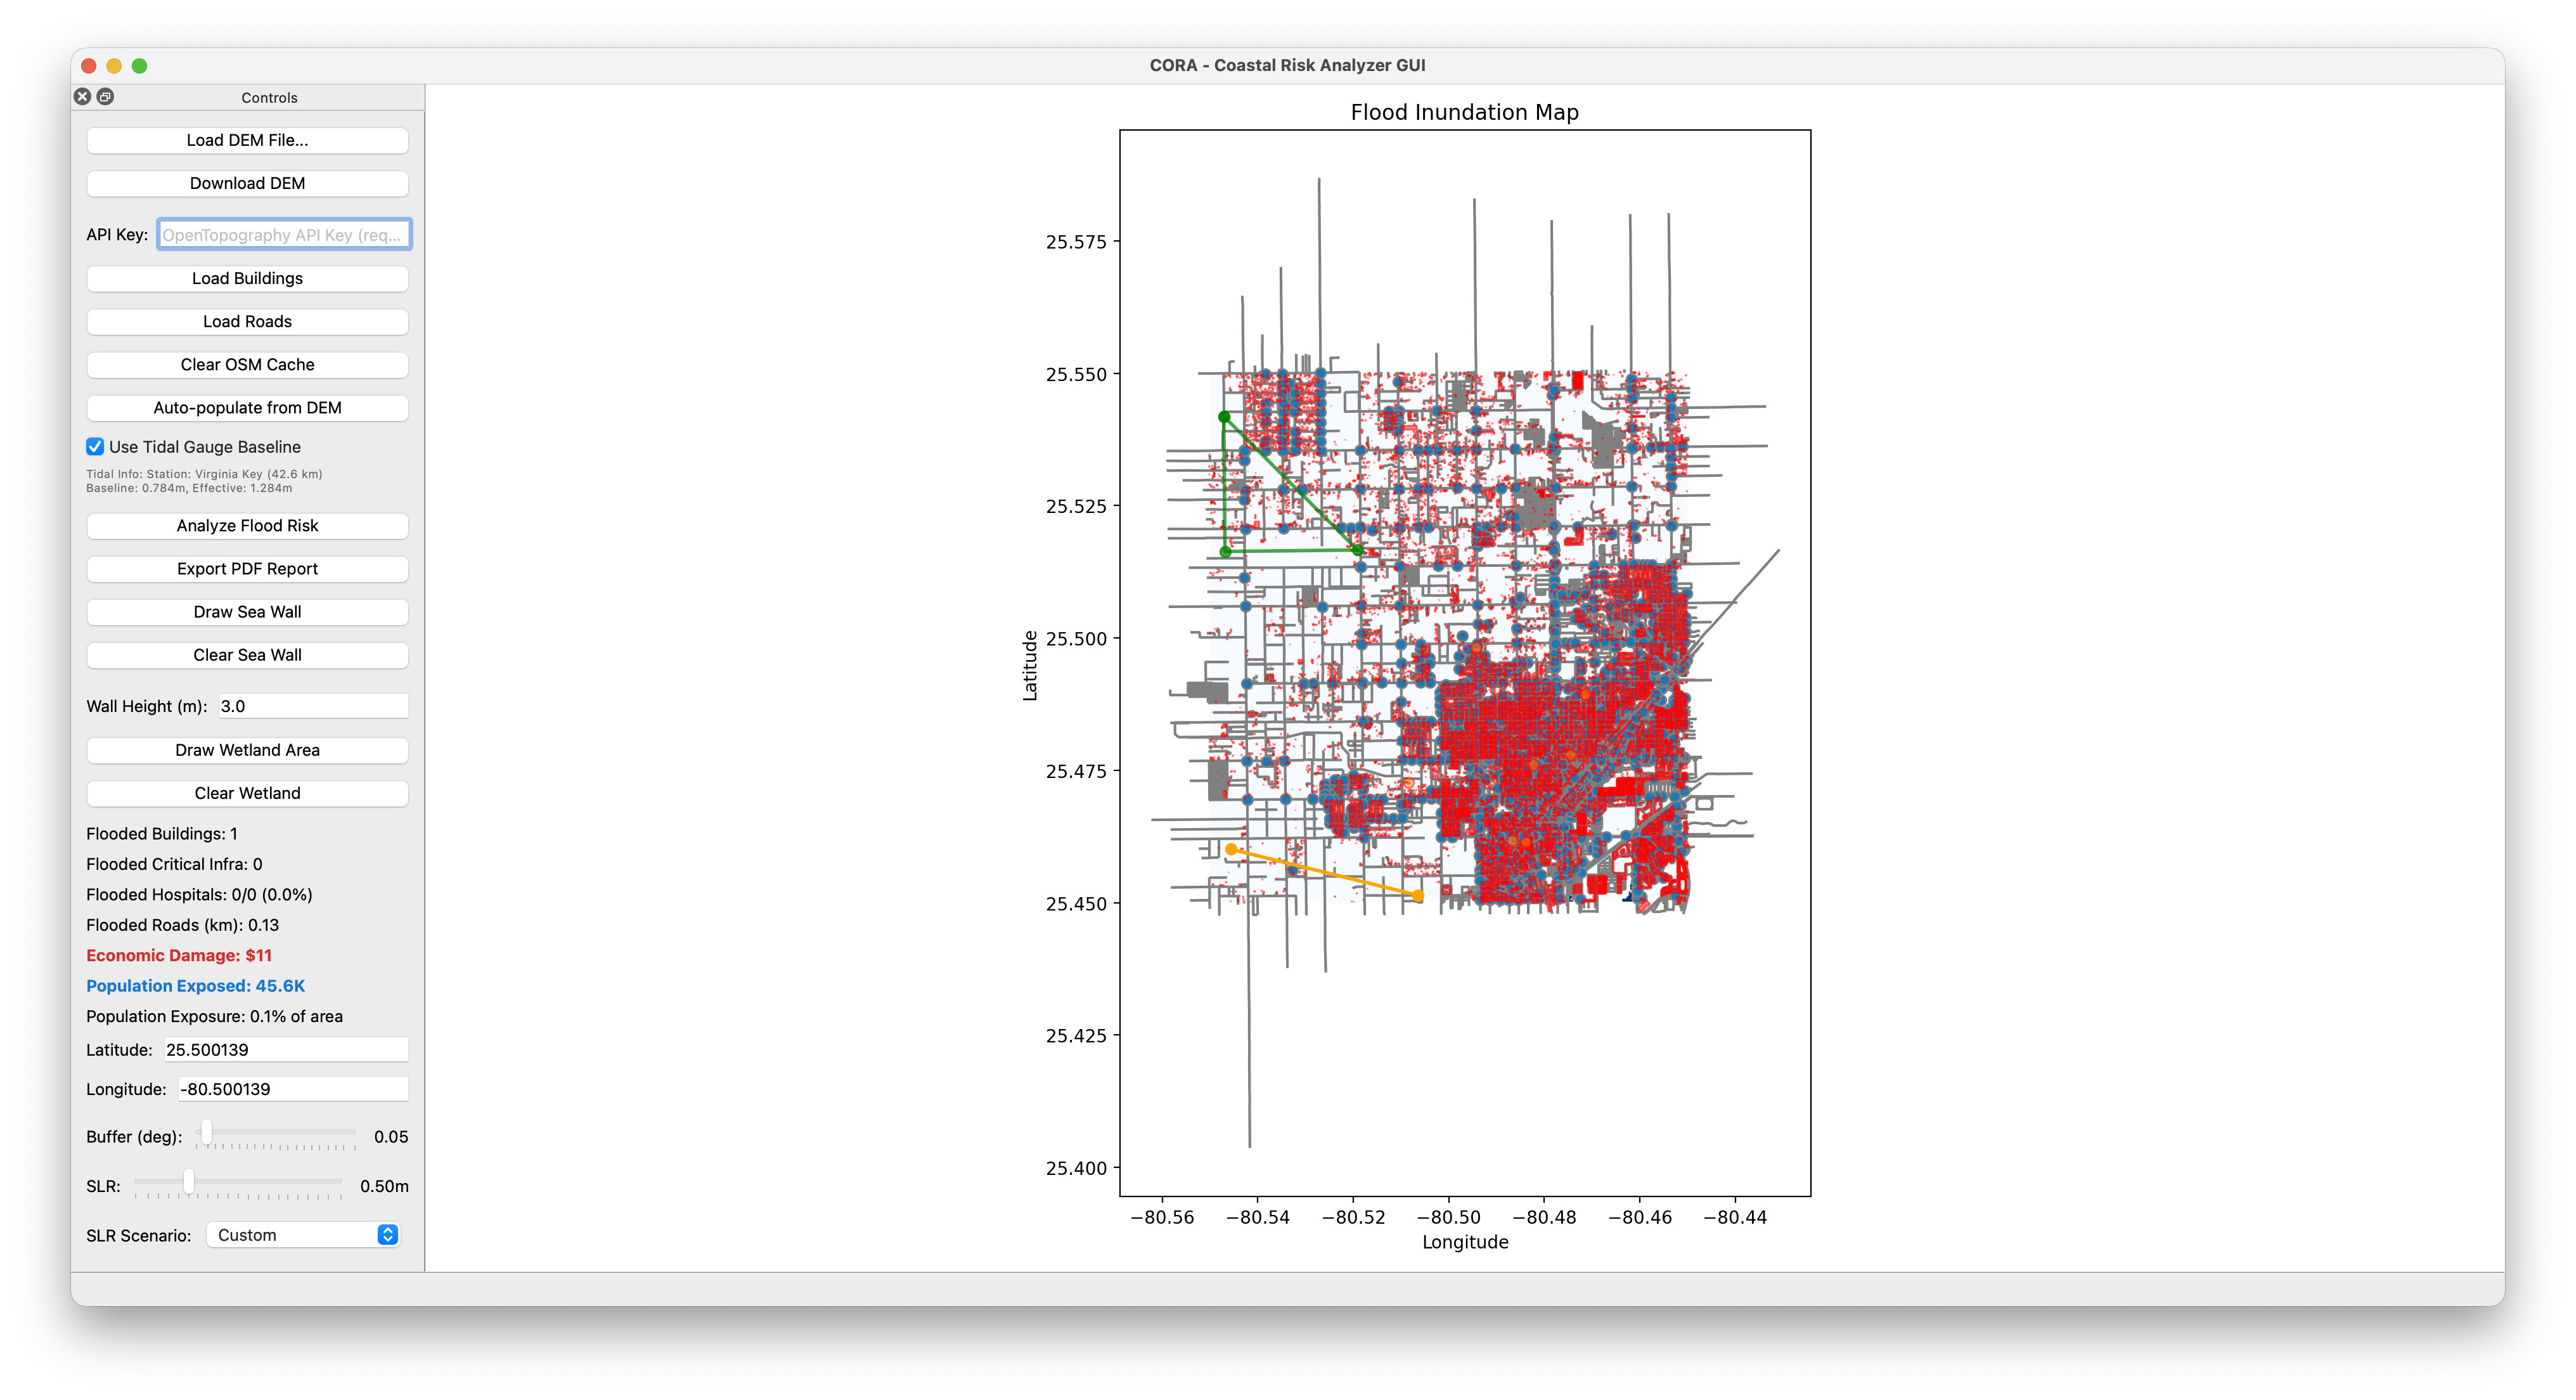
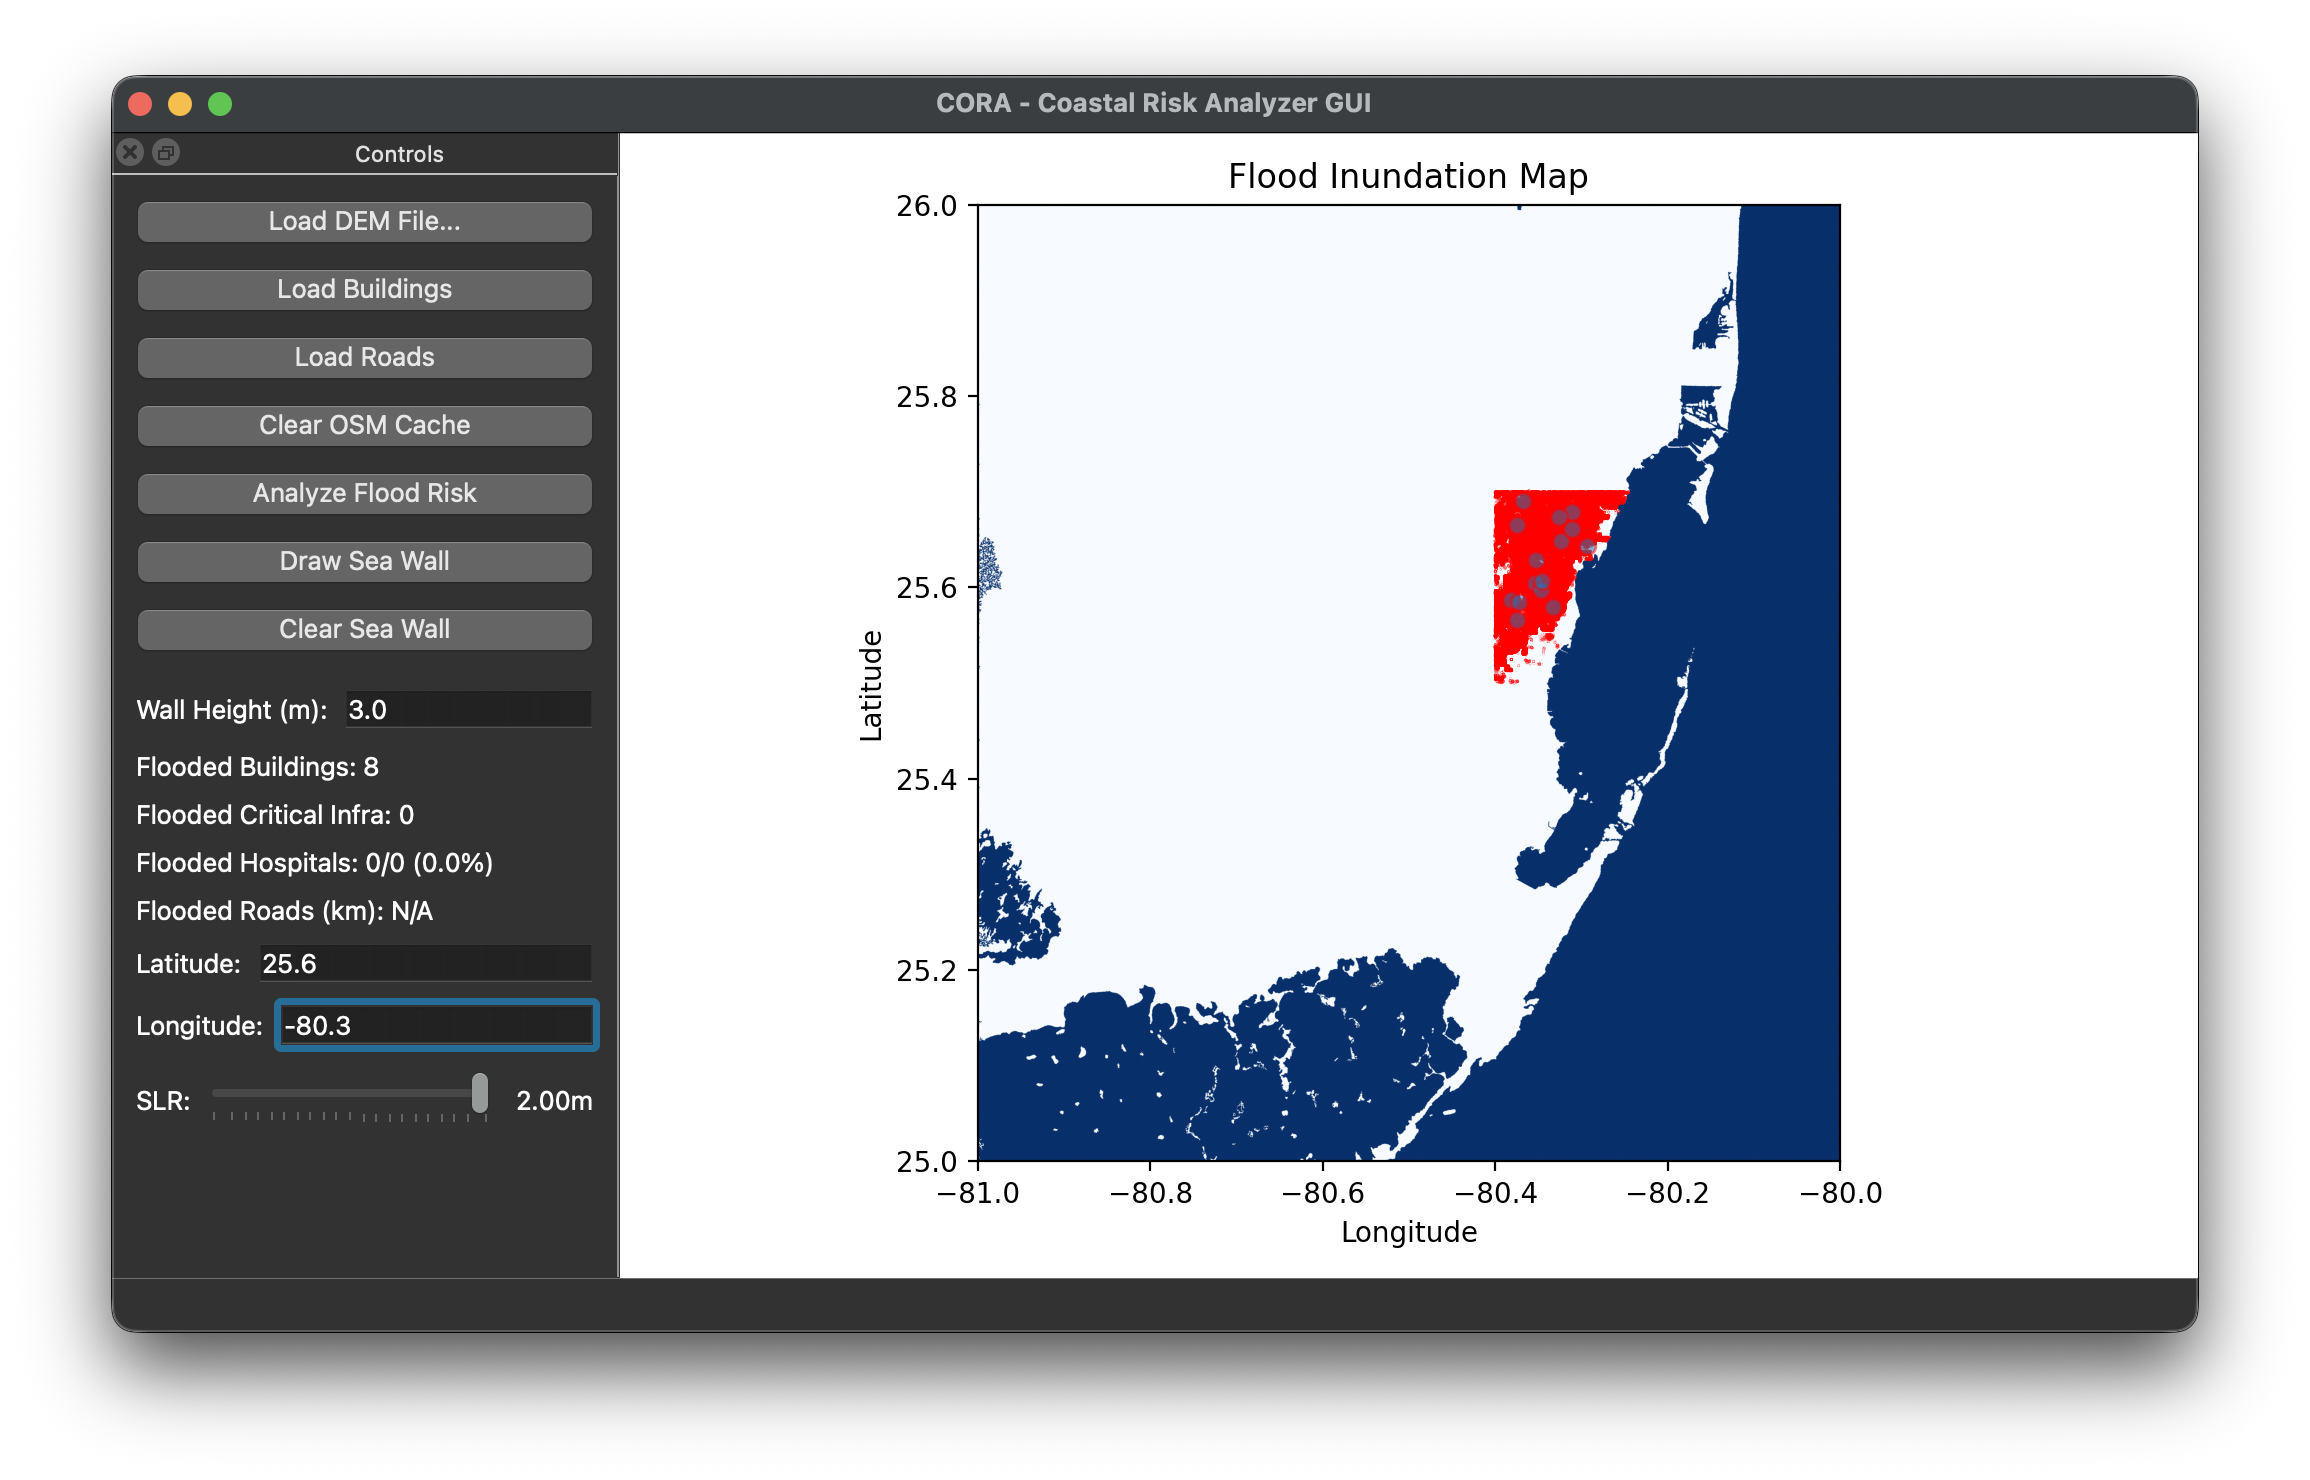
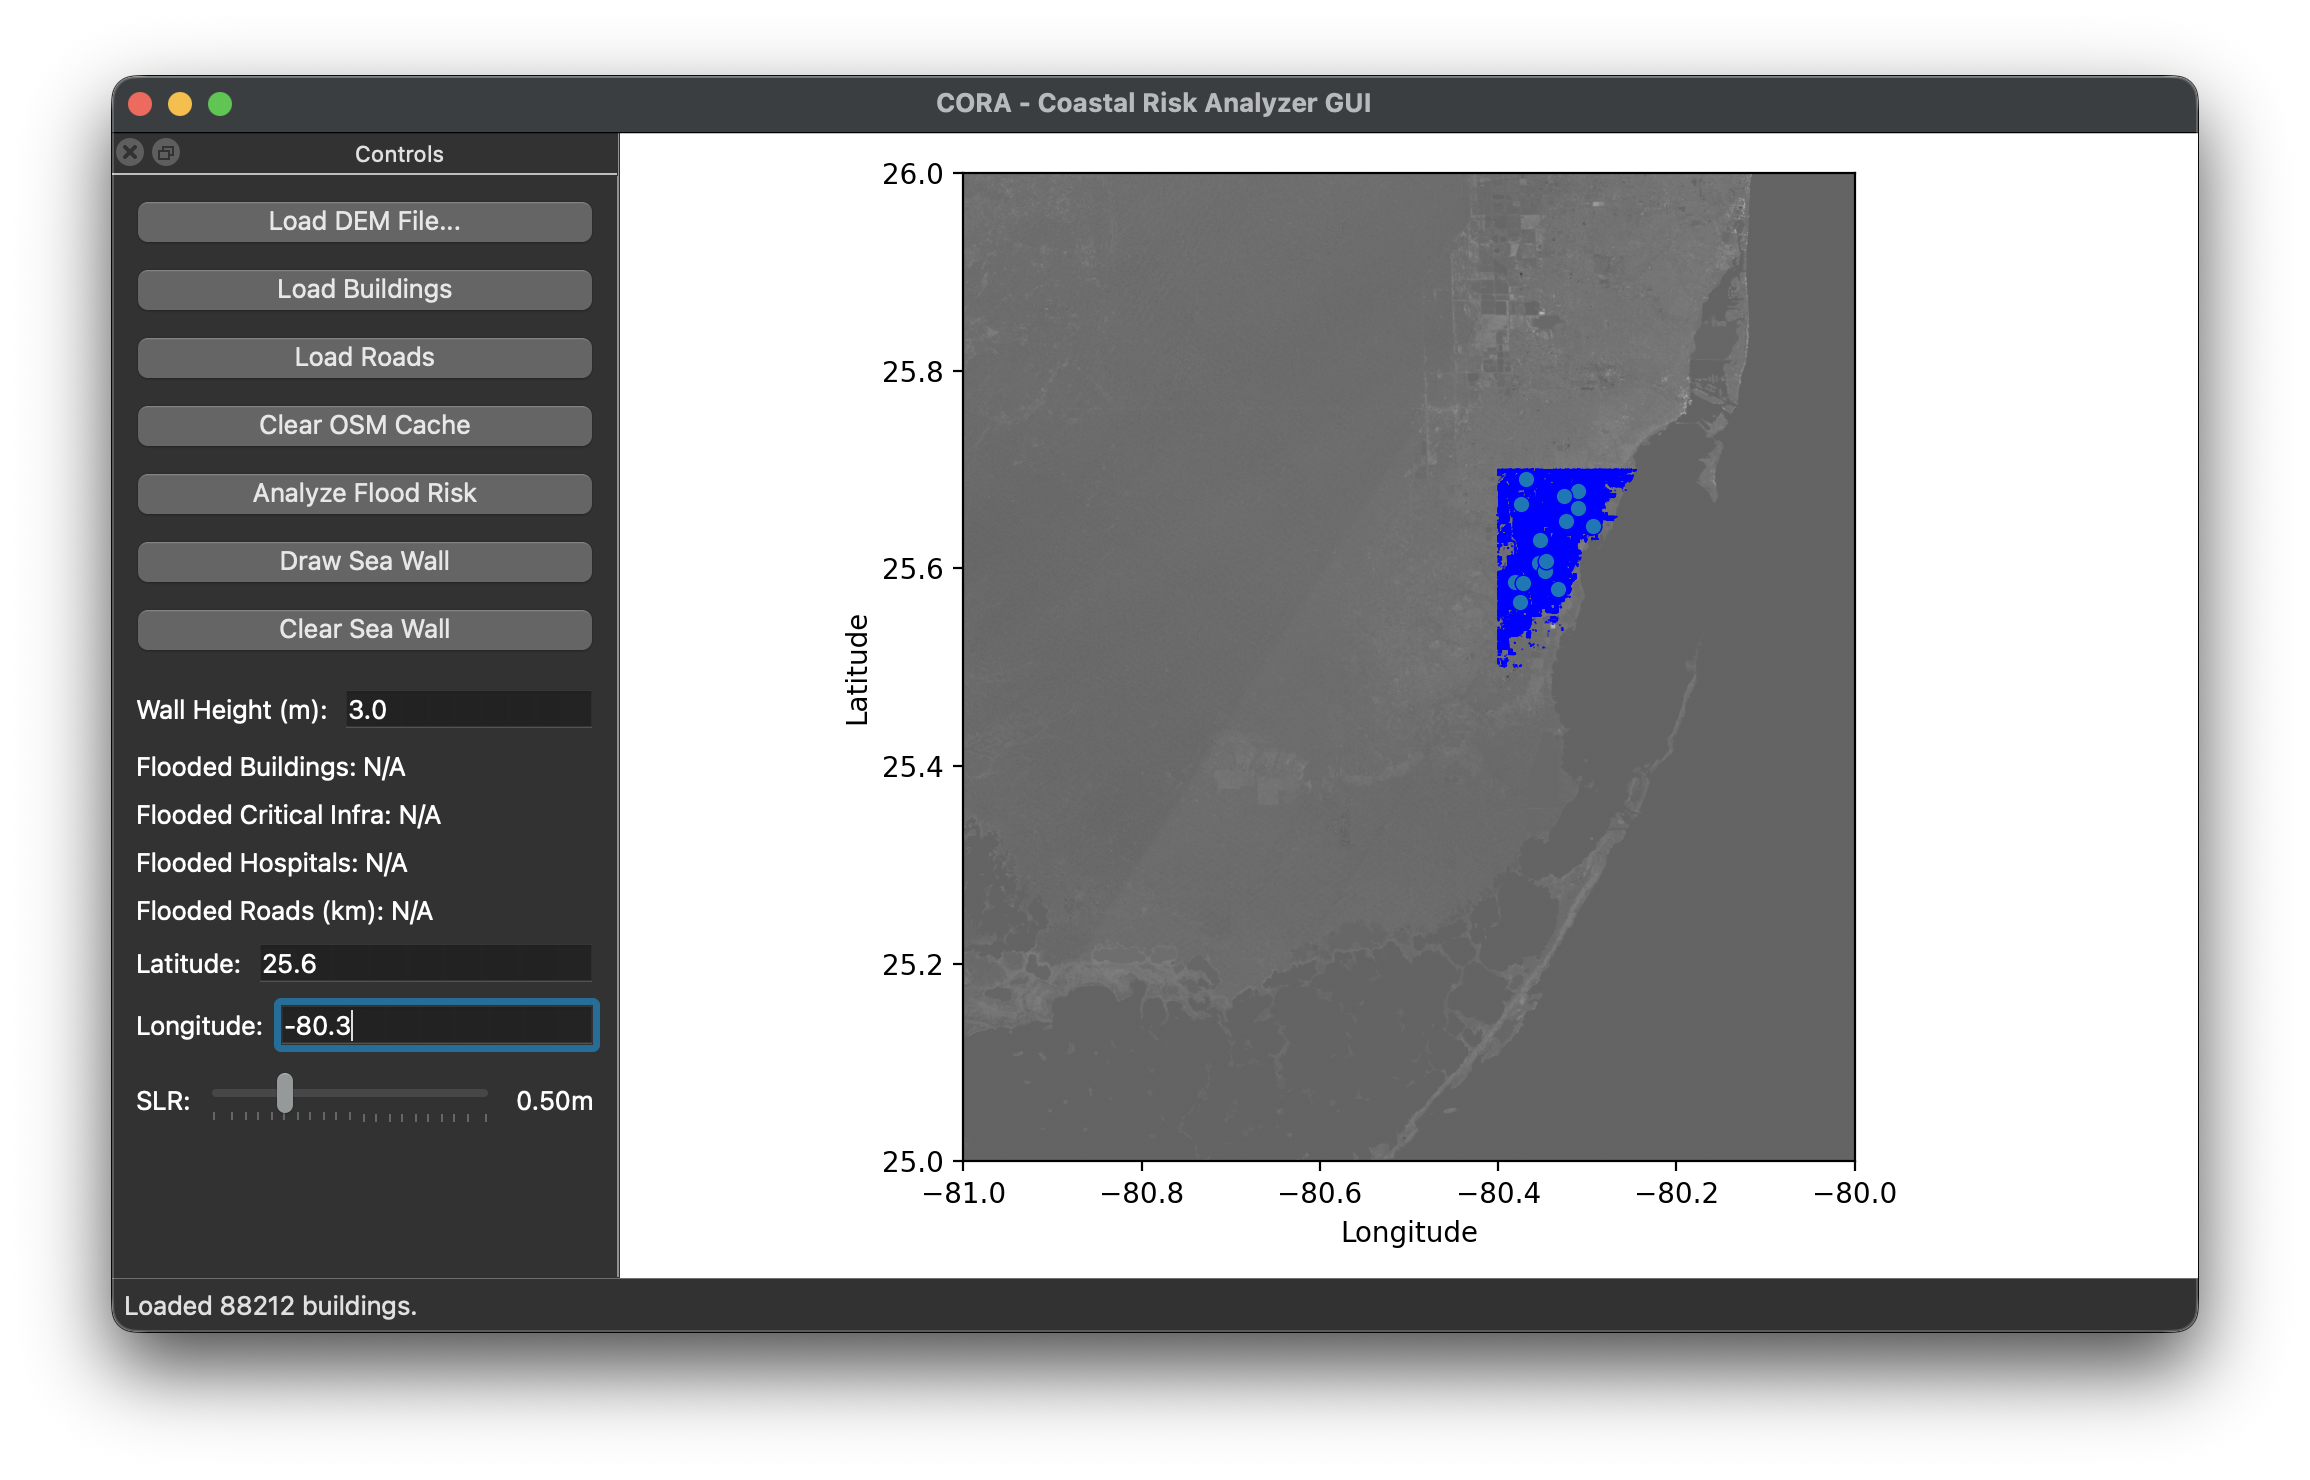
My hometown in China is very close to the coast. After learning more about global warming and its impact on coastal communities, I wanted to create something that allowed us to see the destructive consequences of sea level rise. My most notable data science project, CORA is a tool that uses datasets and graph-based algorithms to simulate sea level rise floods, predict economic damage, and test adaptation strategies.
The application loads Copernicus elevation data for any stretch of coastline, pulls the buildings and roads underneath it from OpenStreetMap, and anchors the model to the nearest NOAA tidal gauge so the baseline reflects measured local sea level rather than a generic elevation. Inundation is propagated from the sea as connected flood rather than filling every low-lying pixel independently, which is the difference between a map of what is low and a map of what actually floods.
What comes out is not just an outline. Each run reports flooded buildings, kilometres of road lost, critical infrastructure hit — hospitals, schools, fire stations, tagged automatically from OpenStreetMap — economic damage from depth-damage functions, and population exposure drawn from WorldPop demographic rasters.
Adaptation is the part that makes it a planning tool rather than a picture. Sea walls can be drawn straight onto the coast at a configurable height, and wetland restoration areas outlined to model the flood reduction they buy, so the same scenario can be re-run to see what a given intervention is actually worth. Any run exports to a PDF report carrying the parameters, the impact summary, the methodology and the inundation map.
Screens