Research
A Machine Learning Approach for Water Level Residual Correction Using Geospatial Terrain Features
The Columbia Junior Science Journal, Volume 11, 2025–2026
Flooding causes roughly $8.2 billion in damages every year in the United States alone. Harmonic tide predictions miss the residual — the part of the water level driven by weather and terrain — and that residual is where the damage lives.
Results
84.38%
Lower error over a two-day forecast
At an unseen station, XGBoost with terrain held 0.0763 m RMSE where the temporal-only LightGBM drifted to 0.4887 m.
0.0097 m
One-step-ahead RMSE on validation data
Against 0.0102 m for the temporal-only baseline.
28.26%
Where the baseline still wins
One step ahead at unseen station 9411340, LightGBM's 0.0085 m beat XGBoost's 0.0118 m — reported rather than buried.
Abstract
Standard water level forecasts model time and little else. This work asks whether the shape of the land around a station carries signal the clock does not, by pairing four years of NOAA station data with elevation clips taken from a global digital elevation model and measuring what the terrain adds.
What It Found
Terrain features act as a stabilizing anchor: they barely matter one step ahead, but they stop the model drifting once it starts feeding on its own predictions. Elevation mean and maximum ranked as the top geospatial contributors alongside the first residual lag. The honest caveat is that with enough station history, the simpler temporal model still generalizes better in the short horizon.
Method
- Data
- 15 NOAA water level stations, four years of verified readings at 6-minute intervals (August 2021 – August 2025).
- Terrain
- Copernicus GLO-30 DEM at 30-metre resolution, sampled as 3 km × 3 km clips centred on each station.
- Models
- A LightGBM baseline on 10 temporal features, against an XGBoost model on the same 10 temporal features plus 12 geospatial ones.
- Validation
- 70/30 train-test split with 5-fold temporal cross-validation through GridSearchCV, scored on RMSE and R² for both one-step-ahead and two-day autoregressive forecasting.
Figures
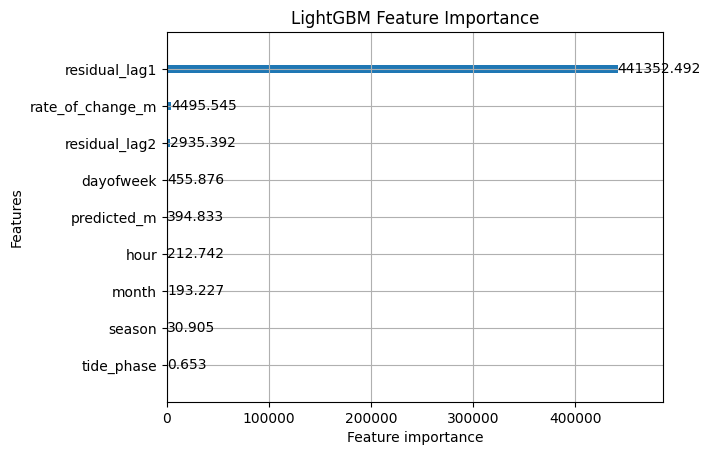
Figure 1
LightGBM Feature Importance
Ranks the relative influence of temporal variables on residual prediction accuracy across 15 training stations. Lagged residuals (residual_lag1, residual_lag2) and the rate of change are the dominant predictors.
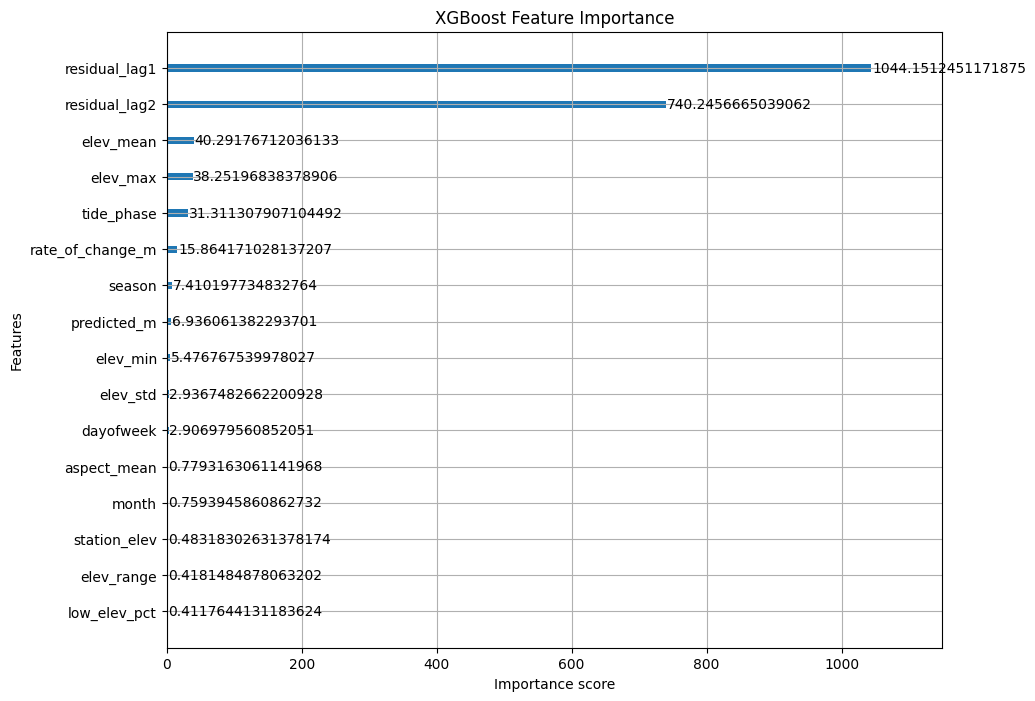
Figure 2
XGBoost Feature Importance
Ranks the relative influence of combined temporal and geospatial variables on residual prediction accuracy across 15 training stations. Alongside temporal lags, static terrain metrics like mean and maximum elevation (elev_mean, elev_max) emerge as top predictors.
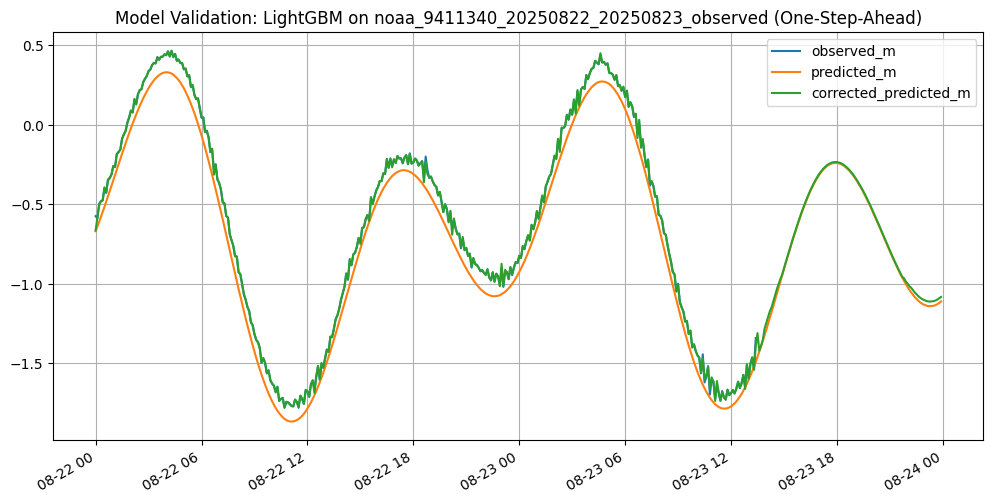
Figure 3
Model Validation: LightGBM (One-Step-Ahead)
Compares water level predictions at unseen NOAA station 9411340 over a two-day period (August 22–23, 2025) using true prior residuals. The graph displays the true measured level (observed_m, blue), NOAA's baseline prediction (predicted_m, orange), and the LightGBM-corrected prediction (corrected_predicted_m, green).
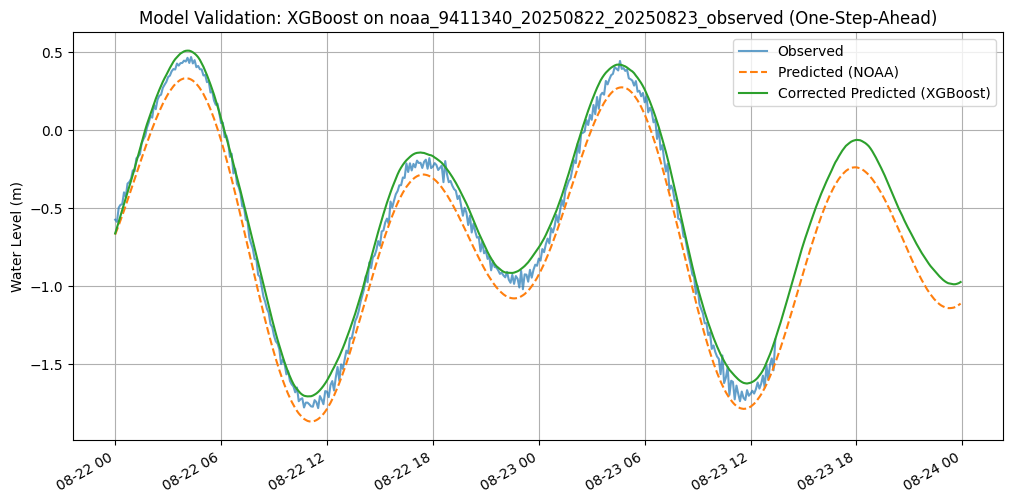
Figure 4
Model Validation: XGBoost (One-Step-Ahead)
Compares water level predictions at unseen NOAA station 9411340 over a two-day period (August 22–23, 2025) using true prior residuals. The graph displays the true measured level (Observed, blue), NOAA's baseline prediction (Predicted (NOAA), orange), and the geospatially-informed XGBoost correction (Corrected Predicted (XGBoost), green).
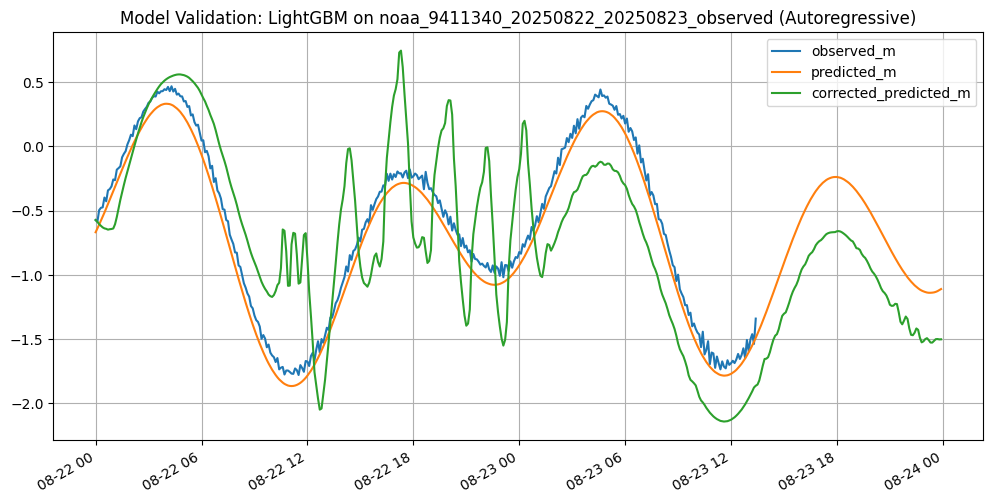
Figure 5
Model Validation: LightGBM (Autoregressive)
Evaluates autonomous multi-step forecasting at unseen NOAA station 9411340 over a two-day period. The LightGBM-corrected prediction (green) deviates significantly from the true observed level (blue) and NOAA baseline (orange), demonstrating rapid error accumulation.
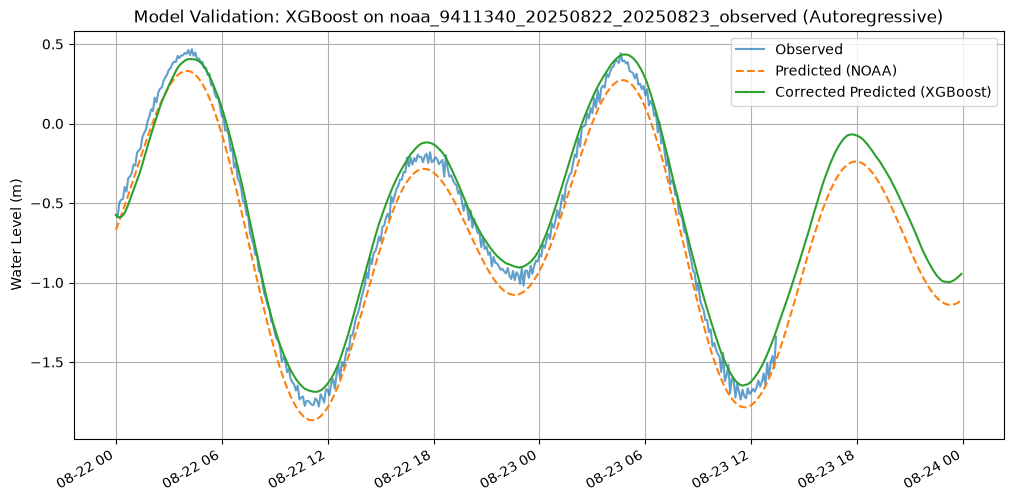
Figure 6
Model Validation: XGBoost (Autoregressive)
Evaluates autonomous multi-step forecasting at unseen NOAA station 9411340 over a two-day period. The XGBoost-corrected prediction (green) closely tracks the true observed level (blue) against the NOAA baseline (orange), demonstrating model stability.